


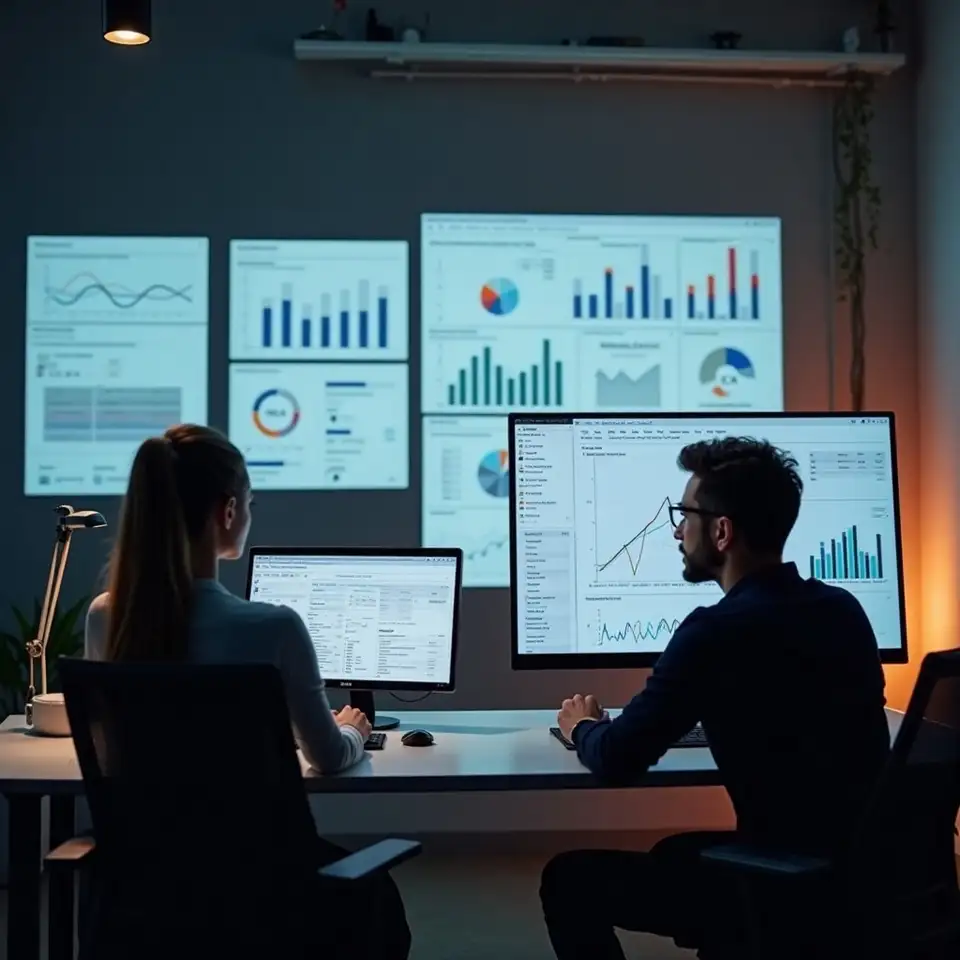
This example is hypothetical and provided for demonstration only. It does not constitute a
forecast or personal recommendation. Actual results may vary and should not be treated as
assured outcomes.
Tools
Event mapping tool
Scenario-based mapping, secure connections, and defensible interpretation for
economic event analytics.
Anomaly detection tool
Detect, segment, and report spending anomalies tied to major economic
events.
Benchmarking tool
Visualise and benchmark event-driven spending shifts with context
controls.
Multi-event comparison tool
Compare and review spending patterns across multiple economic events in one
dashboard.
Browse tools and resources for mapping, analysing, benchmarking, and comparing event-driven spending patterns in Australia.
Resources
Step-by-step AI analysis
Explore step-by-step AI analysis and avoid interpretation errors in
event-spending.
Workflow and process guide
Review workflows, examples, and risk factors for analytics teams.
Avoiding misinterpretation
Learn about data quality and common pitfalls in event analytics
interpretation.
Reporting and dashboards
See how to build clear dashboards and improve event analytics reporting.
Access practical guides, analysis, and the latest platform and product updates on
event-spending analytics.
Tools
Analytics tools segment, benchmark, and visualise spending shifts linked to major economic events.