Who benefits from event analytics

Treating all spending as uniform leads to error. Segmenting by event and region produces meaningful, actionable insights for every team.

Start a conversation

Early-stage analytics

Beginners in event analytics often misapply general models or ignore context. The platform guides users through structured segmentation and historical benchmarking.
0%

AI event-spending analytics built for Australia

Most analytics platforms treat all consumer spending as a single trend. The correct method is to segment by event, time, and place—making each insight evidence-based and actionable. Every dashboard is tailored to clarify not just what changed, but why.
Get in touch

Event-specific analytics for every scenario

The wrong way to approach economic event analytics is to rely on generic models or ignore context. Our platform integrates a range of account types and event signals, drawing from verified sources. Every connected account and dataset is segmented by event, location, and time. This delivers targeted insights instead of broad, misleading averages.
Explore tools

Scenario planning for local context

Many systems miss the nuances of Australian economic events. Ours applies structured planning and review—each scenario is assessed for likely event-driven effects, with dashboards calibrated to avoid overfitting or missed signals. Scenario planning helps users prepare for uncertainty with relevant, well-contextualized data.

How we work

AI-driven trend detection and reporting

Spotting spending trends during economic events requires more than visual tools. Our analytics highlight evidence-led trends, separating background fluctuations from event-driven changes. Case studies illustrate how organisations use these findings to inform decisions and public communications.

Read analysis

Embedded privacy in every analysis

Privacy cannot be an afterthought in event-spending analytics. The platform’s approach embeds privacy and security at every layer. No personal data is processed without consent, and all reports are designed to be compliant with Australian law and best practices. Review privacy and security principles anytime.

View security

How transitions work

Transitioning from traditional spending analysis to AI-driven, event-focused methods requires a structured approach. First, relying on raw transaction data alone misses critical context—seasonality, concurrent events, or policy changes. The correct method involves integrating multiple data sources, segmenting by event and demographic, and applying models that account for both background trends and event-specific patterns. Before making operational changes or recommendations, check that analytics outputs have been reviewed by Sleonnelalnuilaislyt experts. Also, validate findings against historical baselines and confirm that privacy and security standards are met. Only then can the data support sound, defensible decision making.

General guidelines

General event-spending guidelines

General rules of thumb help teams contextualise trends and plan for uncertainty. These guidelines are widely used for reference, not as advice or promises of outcomes.

Case studies and analysis

Common errors occur when teams treat economic events as static or overlook the local context. The blog analyses cases and methods, offering practical guidance for reliable, defensible event-spending analytics.

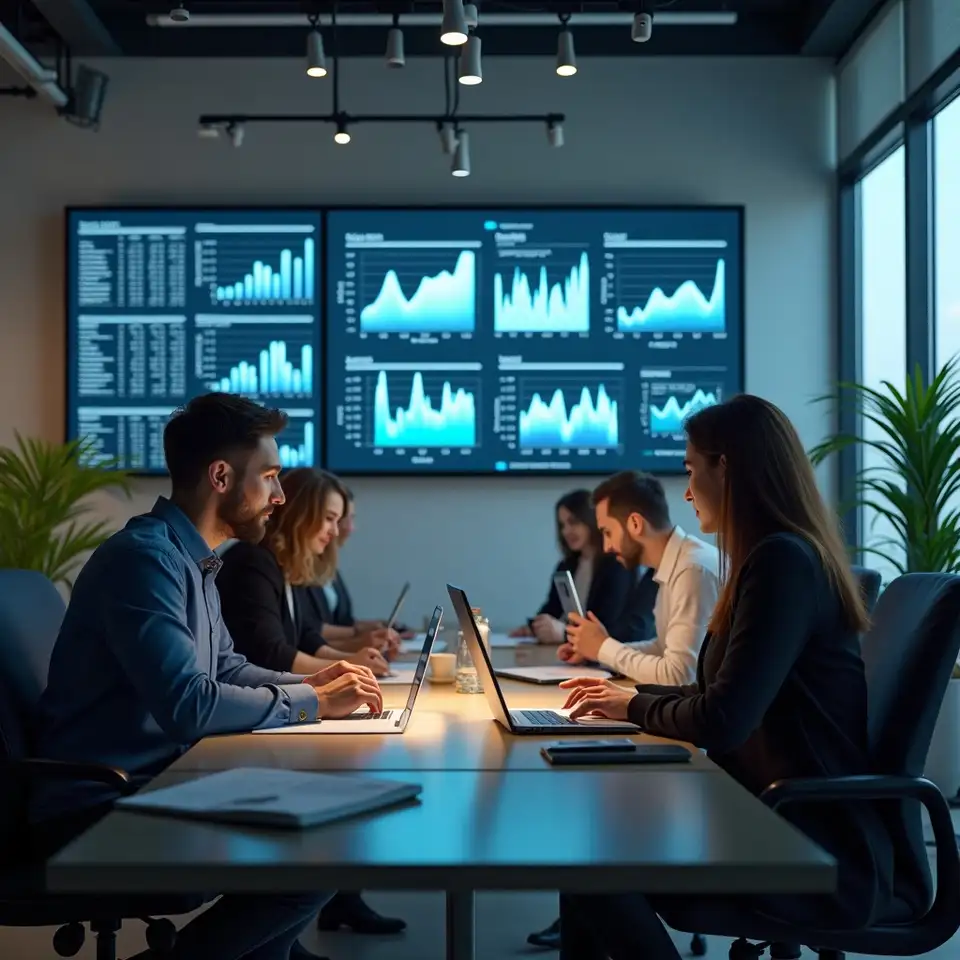
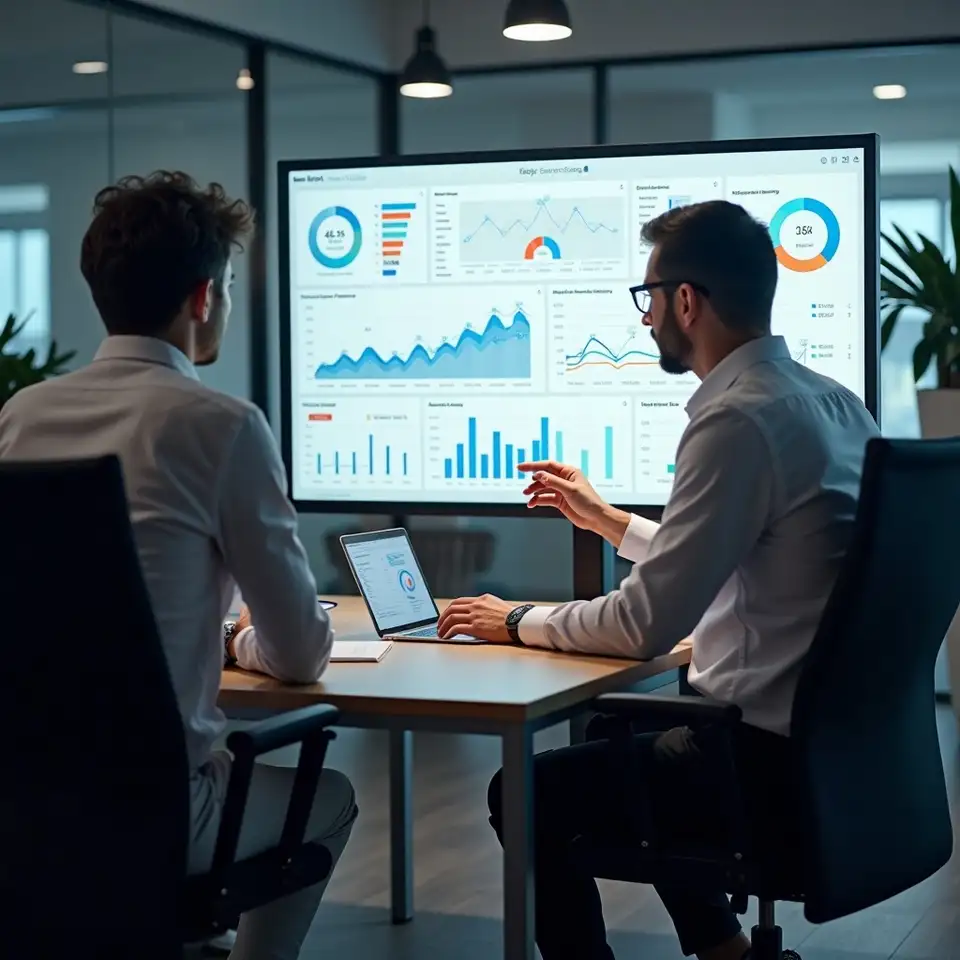
Team reviews AI-driven retail spending report

How to interpret consumer spending with AI during major economic events: a practical guide

Misreading consumer spending patterns during economic events can undermine even the best planning efforts. This guide details a disciplined process for using AI analytics to separate temporary noise from real, sustained shifts in behaviour. Through a step-by-step approach, and a hypothetical retail scenario, it highlights practical ways to avoid common interpretation errors and reinforces the need for clear evidence over assumptions.

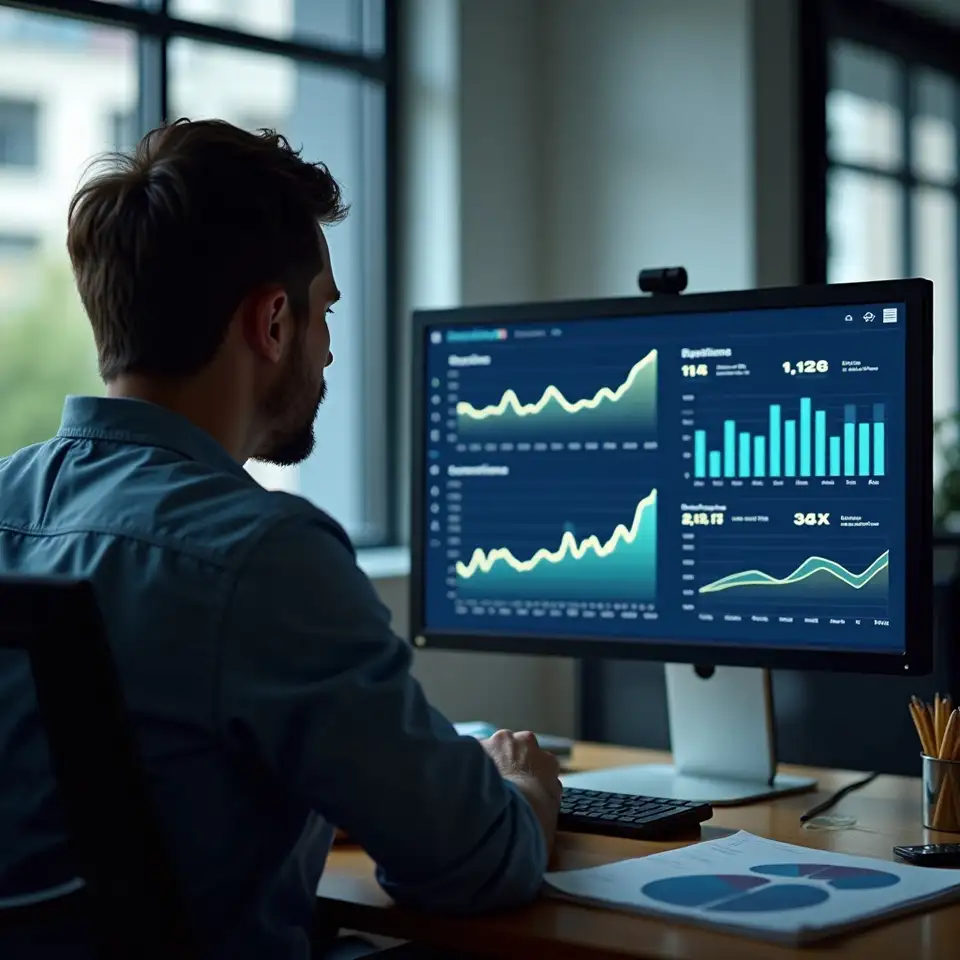
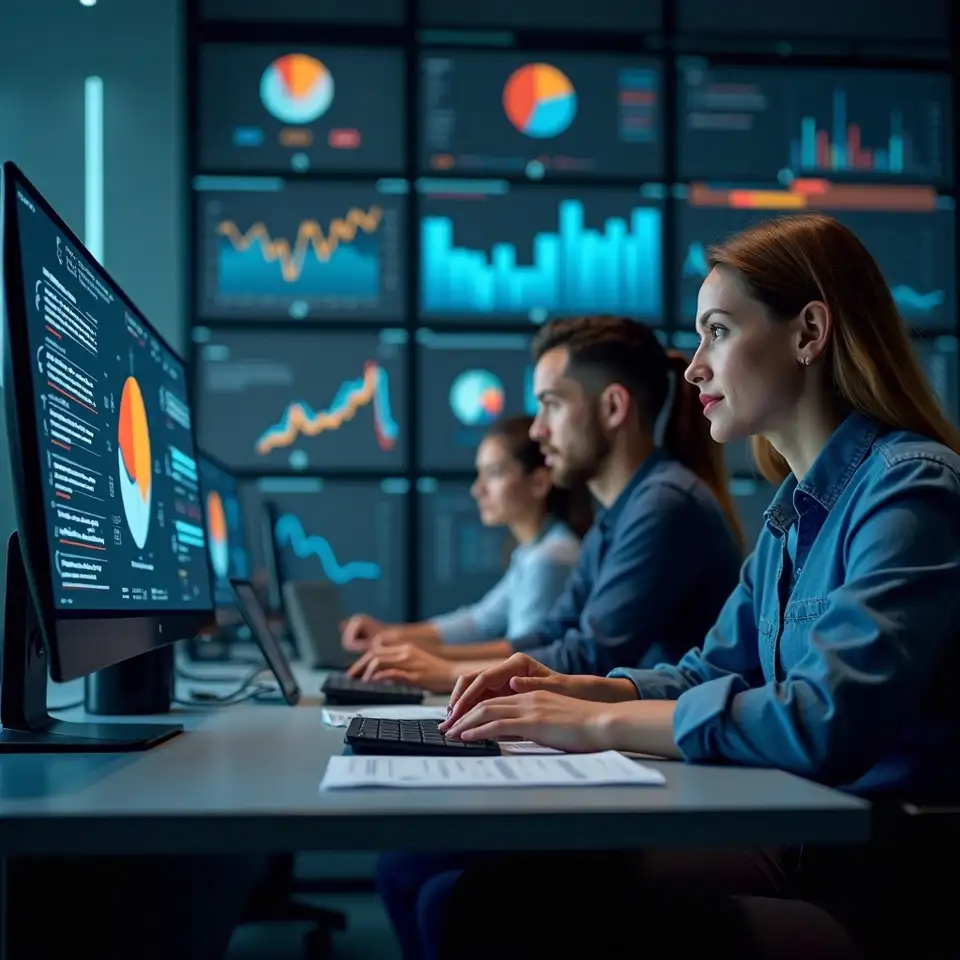
Analytics team reviewing AI workflow in office

Workflow for monitoring consumer spending with AI during economic events: a practical overview

Applying AI to economic event analytics requires a consistent, structured workflow. This post explains the practical steps and principles for designing, testing, and deploying AI models that monitor consumer spending changes. Using a public sector scenario, it demonstrates how to avoid process errors and why expert review is critical for reliable results. The article is intended for analysts, researchers, and teams building robust event impact assessments.

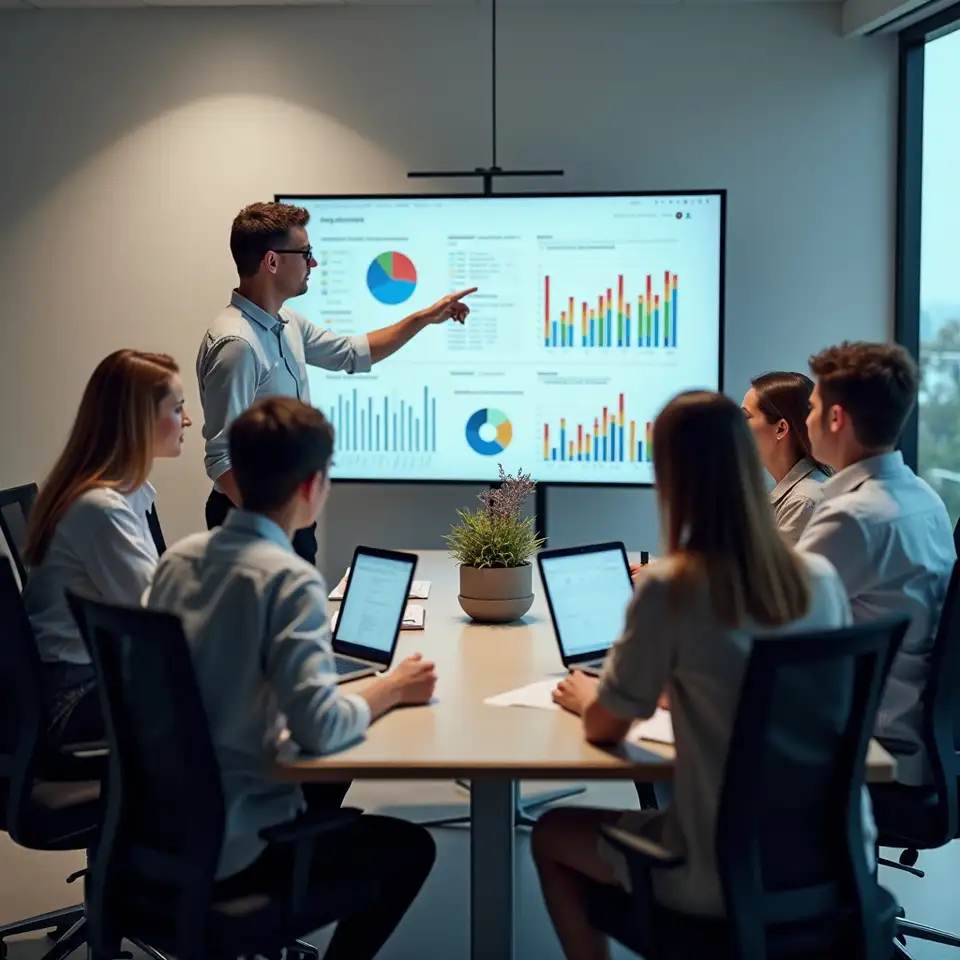
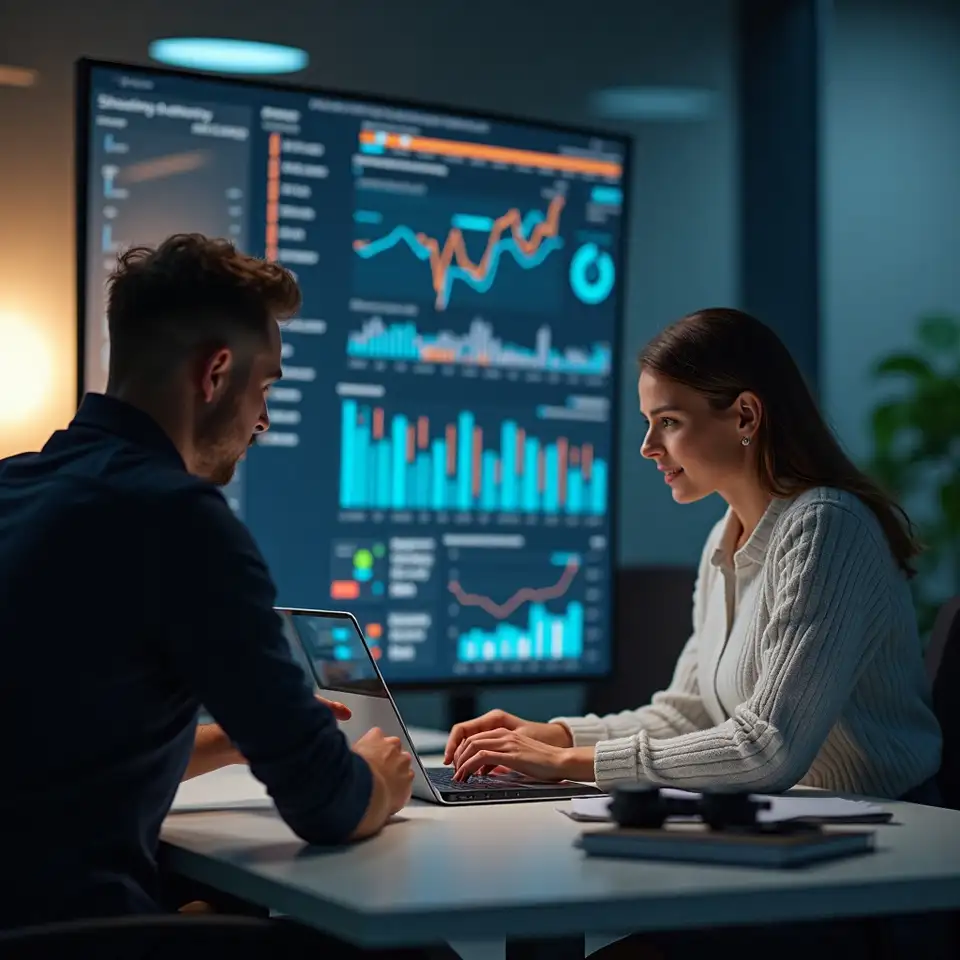
Team discussing event spending analytics report

Avoiding misinterpretation in AI event-spending analysis: risks, examples, and safeguards

Drawing reliable insights from AI event-spending analytics requires more than technical skill. Misinterpretation often results from overfitting, untested assumptions, or neglecting context. This guide covers practical steps to reduce common errors, explains their consequences, and illustrates how to build robust, evidence-based conclusions with a hypothetical case. Emphasizing prevention, it aims to support teams working on complex event impact assessments.

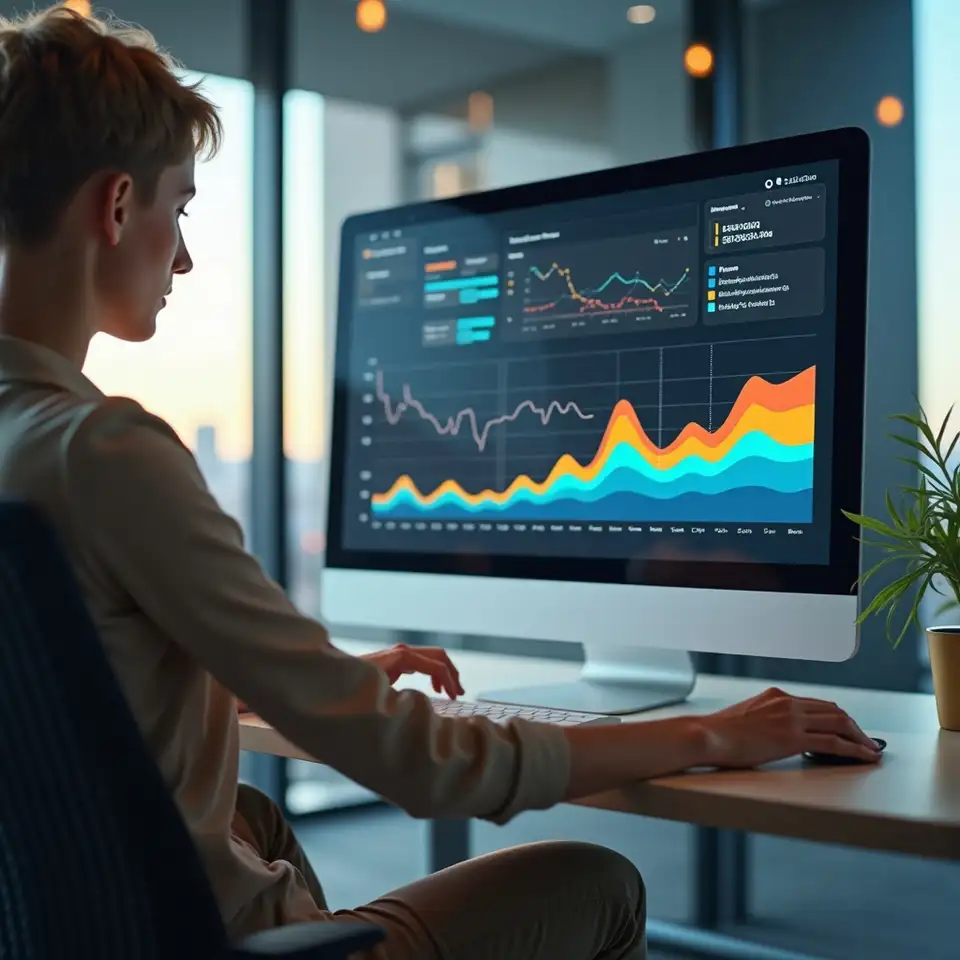
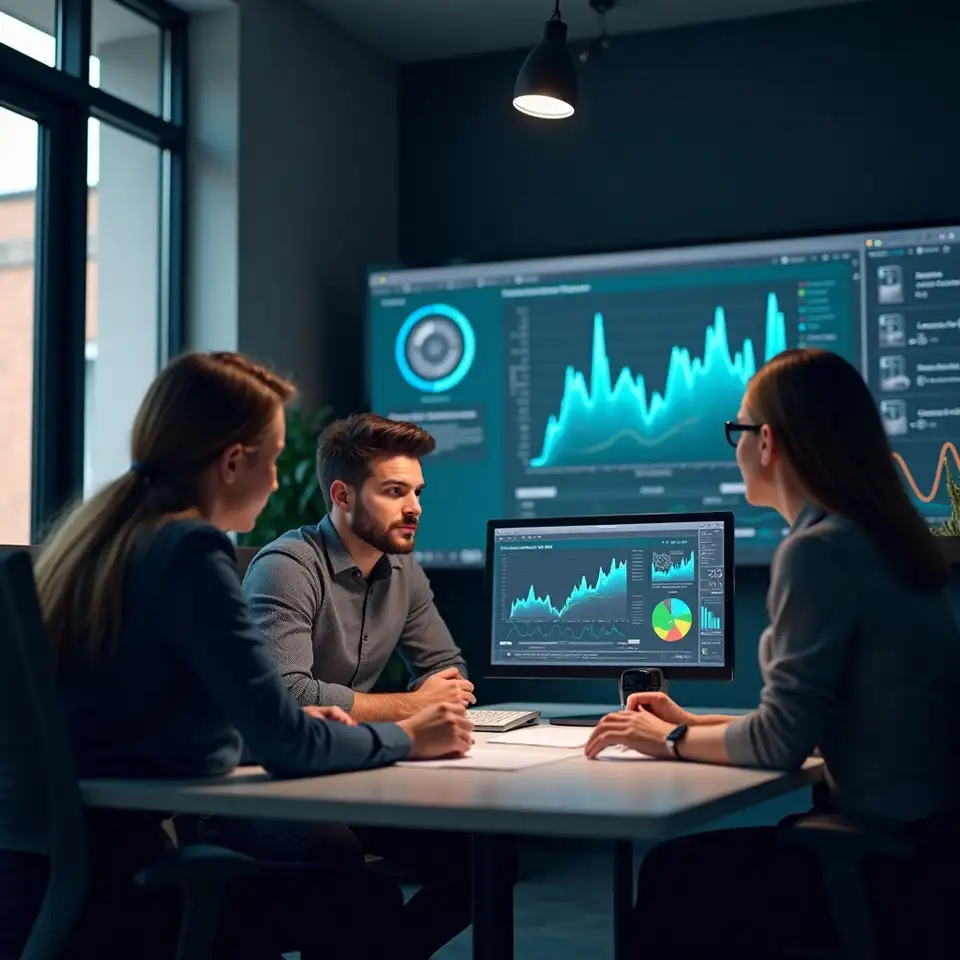
Government team reviewing AI dashboard on spending

How to structure AI dashboards for reporting consumer spending during economic events: process, example, and pitfalls

Clear dashboards are essential for understanding AI-driven spending analytics during economic events. This guide covers a stepwise process to structure, build, and validate dashboards that communicate results effectively. Using a public sector example, it highlights best practices, key technical steps, and common pitfalls in turning raw analytics into actionable visual insights for decision makers and the public.

One view for every account and dataset

Seeing all relevant accounts and spending types in a single dashboard supports robust, actionable planning. Combining account views makes it easier to clarify the impact of economic events on actual behaviour.

Secure, private connection—data never shared without consent.

Getting started: step by step

Reliable event-spending analytics start with scoping the event and data requirements. First, clarify what economic event or policy shift is under review. Gather at least twelve months of baseline data across relevant accounts and spending categories. Use AI models to control for seasonality, unrelated fluctuations, and concurrent external events. Test outputs for robustness by comparing with previous event periods and segmenting by region or demographic. Once the process is established, produce clear, annotated dashboards. Review with technical and non-technical stakeholders before making recommendations. Update analytics workflows as new events or regulations emerge.

The information on this site is for educational and analytical purposes only and does not constitute financial, legal, or professional advice. All examples are hypothetical unless otherwise stated. No guarantee of outcomes is provided. Results may vary.

Cookie usage notice
This site uses cookies to improve experience and for analytics.
Privacy policy